Sunday, January 29, 2012

Analysis of E-Commerce in Middle East & North Africa - Part 1


Introduction
Fig 1: Insights MENA photo, a website which specializes in studying internet consumption in MENA region. Source: http://www.insightsmena.com/ en/   

Internet and the digital world have become an integral part of daily life for a large number of people across the globe. For many, a considerable amount of time daily spends on the web. The digital world is also making strong inroads in the commercial space. According to a survey conducted by “Neilson”, 875 million individuals have purchased online, at least once a year. According to “world internet statistics”, as on 2011, Middle East constitutes only 3.4 percentages of the global users and hence does not contribute much on the e-commerce front. (If North African countries be included, the percentage will go a bit higher). Even though it does not play a very big role so far, e-commerce seems to have a great potential in the near future. The future growth could be fuelled by-high economic growth, young demographics, investments in the ICT infrastructure and political transition. Keeping this in mind, “Management Guru Blog”, will do a comprehensive analysis of the overall e-commerce industry in the MENA region. The entire report will be produced in a series, delving into the various aspects of e-commerce in the region. The very first in the series, will a give a brief description of the internet consumption as well as e-commerce activities in the region.        

E-commerce Statistics for Middle East & North Africa (mena)


Table 1: shows the GNI per capita and internet penetration in some selected MENA countries. Source: World Bank.

                    Table 2: Shows, mobile internet usage, in terms of percentage. Source: Insights MENA


Fig 1: shows the average weekly internet consumption by internet users (non internet users are not included in this), in minutes for the entire MENA region as well as for selected economies. The total internet consumption is the sum total of average weekly access via laptop/desktop and mobile. Source: Insights MENA


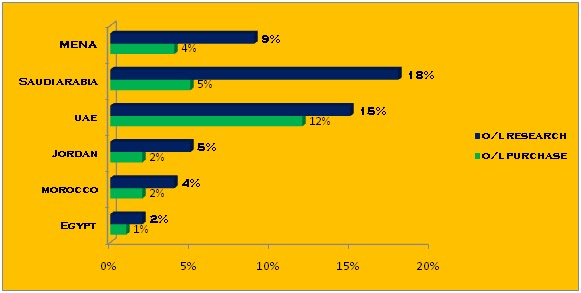
Fig 2: shows the percentages of online research and purchases made, across the overall population (includes internet users as well as non users), for MENA region and some selected economies. Source: Insights MENA. 


Fig 3: shows the percentage of internet users, who always pay attention to online ads while surfing the web, for MENA as well as other individual economies. Source: MENA Insights.


Table 3: shows the average weekly frequency, of some selected online activities, for internet users of MENA region and some individual economies of the region. Source: Insights MENA


Analysis

Some of the key findings of the statistics are as follows:

·         High per capita income influences high e-commerce activities: Countries like UAE and Saudi Arabia have fared well than their other Arab counterparts, on account of high per capita income. High per capita income results in high penetration of- internet, internet enabled better quality handsets, credit cards etc. This eventually has resulted in high percentages of E-commerce research and purchase activities, in these countries.

·         Unique case of Saudi Arabia: Saudi Arabia, the largest MENA economy, enjoys a comparatively high internet penetration and internet enabled mobile usage of, 41 and 54, percentages respectively. It has a very high online research percentage of 18 and  42 percentages of internet users claim to always pay attention to online advertisements. In spite of having strong arsenals, the overall percentages of e-commerce stands at moderate five percentages, just one percentage point higher than the overall MENA average of four. It seems, cash based culture and low reliance on credit cards, coupled with under performance in the 45 plus segment, has deterred Saudi Arabia from realizing its full e-commerce potential.


·         Jordan has huge e-commerce potential: Jordan offers another good case to study. Unlike gulf countries, it does not have any natural oil resources of its own and according to “World Bank” is considered as a developing nation with moderate per capita GNI of US $ 5,790. But, the tiny Levant state is also among one of the most innovative Middle Eastern countries and in the recent years have taken strides in the areas of, innovation and technology adoption. It enjoys decent; internet penetration, average weekly internet consumption and outlook towards e-commerce. A close look to some of the online activities of an average Jordanian internet user provides lot of interesting insights. An average user clicks an online ad, some 5.93 times a week and spends considerable time in research also. But when it comes to buying a product online, seems he hardly engages himself.  It might be due to the same factors preventing other countries as well- cash based culture, low credit card penetration and apprehension of using the internet for making payments. Jordan can be considered as one of the huge potential market for e-commerce in the region. With higher credit card/debit card penetration and education campaigns, higher e-commerce percentages could be realized in near future.
 

Monday, January 16, 2012

Comparative Analysis of Retail Industry of Malaysia & Saudi Arabia


Fig 1: shows an eXtra store, Saudi Arabia’s leading electronic retail. Source:  alroyya.com


Retail industry is the part of the economy, involved in selling finished products to the end users. Retail shops could be found in wide range of formats, ranging from large hyper markets and department stores, to small convenience stores and general stores. It primarily includes six sub categories: - food & general retail, fashion apparels, fast food restaurants, fast manufacturing consumer goods (fmcg), luxury products and electronic appliances & consumer durables.

All across the globe, both in the developed as well as developing world, retail industry plays a pivotal role in the national economies. It has a wide range of direct as well as indirect economic significance- ranging from mass level employment generation (both urban and rural) to bringing, speed and efficiency into the entire supply chain system.   

The given report intents, comparing retail sectors Malaysia and Saudi Arabia; one an emerging economy and a constitutional monarchy from South East Asia and other an oil rich Islamic Monarchy from the Gulf. Both the nation, share similarities across various socio-cultural as well as demographic parameter. Hence provide a good case to do comparative analysis. They will be compared across following parameters- economics, retail industry outlook, policy frame work, tourism, demographics and transportation.  

Economics, demographics & infrastructure

The following part compares Malaysia and Saudi Arabia, across few of the general economic, demographic and infra structure related parameters.

Fig 1: shows the GDP growth rate of Malaysia and Saudi Arabia vis- a-vis, world’s growth rate.

Table 1: compares Malaysia and Saudi Arabia across various economic parameters. Source: World Bank

Table 2: compares Malaysia and Saudi Arabia across parameters related to infrastructure. Source: World Bank.

Retail industry outlook

Malaysia

Malaysia, an upper middle income country according to World Bank, enjoys a robust and growing retail sectors. According to Business Monitor International, total retail sales in Malaysia were estimated at US $ 33 billion, in 2009.  Like other Asian countries it has penchant for gigantic malls and hypermarkets and is dominated by players such as Giant (domestic), Tesco (UK) and Care four (France). The retail sector in Malaysia is fueled by large proportion urbanized middle class (50% of the population) with high disposable income; a large proportion of youth (42% aged between 10 and 34, as on 2008) and high tourist arrival. Tourism accounts for 30% of retail consumption in Malaysia.  (RECON, 2008)


Fig 2: shows the growth in retail sales vis-a-vis GDP growth rate for 2010. Source: Thestaronline.com 


Fig 3: shows the number of outlet and total sales for major retailer in Malaysia for 2009. Source: Malaysia retail annual report, USDA Foreign Network.

Saudi Arabia

Saudi Arabia is the biggest Gulf country and the biggest economy in the Middle East and North Africa region (MENA) region. The region is marked by growth in retail space, young demographics, high tourist arrival and change of role of women in social sphere. Saudi Arabia, the biggest and one of the freest economies in the region, is considered as one of the most fertile market for the retail industry. Rapidly growing population, brand conscious young demographics (45 percentage of population aged 20-44) and high level of disposable income will be key drivers for the industry, in the kingdom. After oil, banking and telecom; retail is the fourth largest industry in the country, both in terms of number of, establishments as well as employees. It earned a total of US $ 55 billion, from retail sales in 2008, up from US $ 37 billion in 2004. (PR Log, 2009) The market is dominated by small retail stores, though big retailers, both domestic and international players, are trying to up their ante in the much fragmented retail industry.     

Table 3: shows values for various retail industry related parameters. Source: JONES LANG LASALLE, AMEinfo.com 


Fig 4: shows the retail sales of Saudi Arabia, in billion US $, over the last few years. Source: AMEinfo.com


Presence of major retail brands in Malaysia & Saudi Arabia

The following part of the report will compare the presence of few of the leading retail brands in Malaysia and Saudi Arabia. The no. of outlets, in some of the cases, has been described in brackets.
Table 4: shows the presence of some of the major retail brands in Malaysia and Saudi Arabia. Source: Mystore411.com and others


Policy   
One of the key pillars for the growth of any industry in a country is policy and regulatory framework. An open and market oriented policy framework are more likely to stimulate growth and development in the long run. The following part of the report will compare Malaysia and Saudi Arabia across general business environment as well as policy framework pertaining to retail industry.
Retail business environment
General business environment


Saudi Arabian economy is marked by liberal economic policies and free market mechanisms stimulating foreign investments. The kingdom has biggest oil reserve outside Soviet Union and USA and like other Gulf counterparts, aim at diversifying its economy into industrial and service sector. The state generally does not interfere with the inflow and outflow of capital. It incentivizes businesses by providing favorable tax exempts, subsidies, provision of land at low price, exemption of custom duties on export etc.  (Al A, 2007)

In line with Saudi Arabia, Malaysian economy is also marked with investor friendly business environment. During 1970s, when Malaysian economy was primarily based on mining and agriculture, govt. took diversification measures backed with centralized planning. During 70s to 90s, like other Asian Tigers, Malaysia recorded a strong economic growth. In the present time also govt. plays a pivotal role in the economy, but gradually it is reducing. One of the remarkable features of Malaysia economy is availability of easy credits.


Malaysia
The key elements of retail industry (especially pertaining to foreign investments) policies of Malaysia are as follows (MDTCC, 2010)

·         Aims at modernization of the industry, ensuring growth of the local business at the same time
·         All foreign involvements in retail sector, including; acquisition & merger, expansion, relocation, buying, taking over etc; require permission from Ministry of domestic trade, cooperative and consumerism (MTDCC).
·          Work force should be reflective of over all racial composition of Malaysian population. It should ensure development of local inhabitants or Bumiputera.
·         Regulatory framework for Hypermarket-minimum capital required is US $15.95 million (RM 50 million), at least 30% stake should be provided to Bumiputera within 3 years of incorporation, minimum floor space should be 5000 square meters and 30% of space needs to be allocated for Bumiputera SME product.
·         Regulatory framework for Departmental store-minimum capital required is US $6.38 million (RM 20 million), and 30% of space needs to be allocated for Bumiputera SME product.
·         Foreign investment is not allowed in the following- super market/ mini market (<3000 square meters), provision shop, convenience stores, fuel station with convenience stores, etc.           

Saudi Arabia

The key elements of retail industry (especially pertaining to foreign investments) policies of Saudi Arabia are as follows:
·         Retail being one of the few sectors, in Saudi Arabia, where 100 percent foreign ownership is not permitted. As per the guidelines, last revised in 2004, the maximum limit for foreign ownership in retail sector is 49 percentages.
·         Any company in Saudi Arabia, with foreign investment, requires a foreign investment license.  
·         Franchising a popular concept used in the Kingdom. Franchise owners need to be local inhabitants and not 3rd party. Many of the leading retail brands such as Baskin Robins, McDonalds, and Burger King Etc operate in the Kingdom in franchise arrangement.   


Tourism

Along with local inhabitants, tourism inflow also helps in boosting retail sales. Both Malaysia and Saudi Arabia are successful tourism destination. Religious pilgrimage is the key driver of Saudi tourism, whereas its Malaysian counterpart depends on exotic beachfront resorts, festivals and medical tourism. The following chart compares tourist inflow of Malaysia and Saudi Arabia.

 Fig 5: compares the annual inflow of foreign tourists in millions, for Malaysia and Saudi Arabia. Source: Tourism Malaysia and Indexmundi.


Demographics
Demographic profile is one of the key drivers of the retail industry worldwide. A young, vibrant and well aware population ensures high spending on retail.   

Table 5: compares Malaysia and Saudi Arabia across demographic parameters. Data are for the year 2010. Source:  CIA World Fact book.

Transportation

A good transportation network, especially high volume of private motor vehicles, ensures the growth and development of out of town hyper markets. In the absence of motor vehicle people tend to visit nearby retail stores only.    
A well developed transport and logistics network does not only help in sales but also ensures better functioning of big hyper market chains. In the absence of good logistic, big hypermarket chains are unlikely to import and circulate retail items in large volume, effectively. 

Table 6: compares Malaysia and Saudi Arabia across transportation parameters (most recent by year). Source: nationmaster.com, numbeo.com


Conclusion

The report has compared Malaysia and Saudi Arabia across various parameters- economics, retail industry outlook, policy frame work, tourism, demographics and transportation. As discussed earlier, both the nations offer a great case to study. They have their own share of agreements as well as disagreements. Some of the key conclusions drawn are as follows:

·         In both the countries, retail sector is important constituent of the national GDP and is witnessing high annual growth. The high growth of the retail sector is fuelled by higher disposable income, high percentages of youth and vibrant tourism sectors.

·         Malaysia is considered as a high middle income country, where as Saudi Arabia, on account of high oil and natural gas reserve, is one of the rich nations in the world. Marked with high per capita income, it is a more fertile ground for luxury retail.

·         Both are luring big retail brands to operate in their country. Saudi Arabia is a better destination than Malaysia in terms of a number of ease of doing business parameters such as – dealing with construction permit, getting electricity, registering property, taxation etc. Malaysia’s strength lies in the easy credits and high FDI in retail; 70 % against, 49 % in Saudi Arabia


·         Malaysia has better infrastructure, logistic as well as telecommunication infrastructure, both considered as a backbone for developing a vibrant retail sector. Saudi Arabian strength lies in availability of gasoline at dirt cheap price and high availability of electricity.


Reference
1>    RECON, 2008, Malaysia: a gateway to South East Asia,
2>    Al Amri, 2007, doing business in Saudi Arabia, available at < http://www.alamri.com/DOING%20BUSINESS%20IN%20SAUDI%20ARABIA.pdf>
3>    Doing Business, 2011, home page, available at http://www.doingbusiness.org/rankings
4>    MDTCC, 2011, Guide lines for foreign participation in the distributive trade, available at < http://www.kpdnkk.gov.my/kpdnkk-theme/images/pdf/WRT_Guideline.pdf> 
5>    Masterintelligence.com, 2011, Master card worldwide consumer confidence index, available at < http://www.masterintelligence.com/ViewRegionReport.jsp?hidReportTypeId=2&hidRegionId=1&hidUserId=null>


Friday, December 30, 2011

Comparative Analysis: Digital presence of five leading tourism destinations of Asia


Introduction

In the present context, which is marked by the gradual shrinkage of regular and conventional media and arrival of digital media, tourism industry is undergoing a rapid transformation. Digital media has become very significant for the travel and tourism industry. It plays a very crucial role in the entire cycle, a traveler undergoes-selection, planning, information gathering, booking, and visit. The following table gives a list of e-marketing activities corresponding to various stages of travel. (Nguyen N, 2007)

Table 1: shows the e-marketing activities corresponding to various stages of travel.


In order to up their ante in this transformed tourism landscape, it is essential for tourist destinations to have a strong presence across various web platforms- travel websites, social media, social media, and mobile application etc. The following report will analyze the online brand strength of leading tourist destinations from Asia- Hong Kong, Singapore, Bangkok, Dubai and Istanbul. It will do a comparative analysis of the online brand presence across the following platforms- search engines (Yahoo and Google), travel websites (Trip Advisor, Frommer, Virtual Tourist, official tourist websites) and social media (Face Book and You Tube) etc.      

Search engines
Search engines play a vital role in any form of marketing. The following part provides a simple estimate of search results related to the five locations in Google and Yahoo, two of search engine giants.

Fig 2: shows the image search results in millions for the five destination in Yahoo & Google

Fig 3: shows the image search results in millions for the five destination in Yahoo & Google

Fig 4: shows the video search results in millions for the five destination in Yahoo & Google

Fig 5: shows the number of search engine results in millions on typing- name of the destination followed by hotels. Exp: Singapore Hotels

Fig6: shows search results in million in Google and Yahoo on typing places to visit. For exp: Hong Kong places to visit.  

Official tourist websites

Websites are the representation of the tourist destinations in the web world. Not only do they build the brand image of the destination but also guide unaware tourist by providing all the relevant information in detail. It helps traveler make travelling decision. Some of the essential requirements of travelers are- direction information/map, visa and policy information, local information, photo gallery, multilingual functions, content categorization, multimedia functions, utility functions etc.  (Quan Z, Rich D, 2005)    Out of all the available websites, the role of an official website is always much more significant, since it represents the official view point. The given part of the report intents to analyze the popularity of official tourist websites of the five destinations both In terms of web analytics as well as qualitative aspects of the website. For web analytics measurement double click ad planner will be used.

Official Websites of tourist destination

Singapore:  YourSingapore.com (www.yoursingapore.com )
Dubai: DefinitelyDubai.com (http://www.definitelydubai.com/)
Bangkok: Bangkoktourist.com (http://www.bangkoktourist.com/)
Istanbul: Istanbul.com (http://english.istanbul.com/)
Hong Kong: DiscoverHongkong.com (www.discoverhongkong.com )

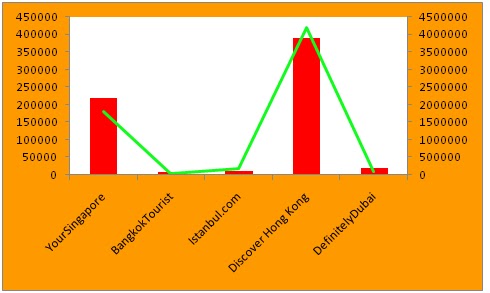
Fig 7: shows the total unique visits and page views for the five official sites, over the month of November 2011. The column chart shows unique visits, where as the line graph shows the page views. Source: double click ad planner. 

Fig 8: shows the average time spent by a visitor in minutes: seconds. Source: double click ad planner

Table 2: compares the home page of the five official websites across some of the basic parameters.

. Table 3: compares the home page of the five official websites across some of the advanced parameters

In terms of unique visitors and total page views, discover Hong Kong has an insurmountable lead over others. This is followed by Singapore; others are far behind. Discover Hong Kong is available in 14 different languages, a unique feature missing in other websites. The closest to this, is Definitely Dubai, which is available in 5 different languages. Other than the multilingual function most of the websites provide all the basic function listed in table 1.  It is the advanced parameters which seem to be the differentiating factor. Yours Singapore has all the five features, followed by Hong Kong with four. The other three have three each. All the five websites have designed very attractive website with lot of multimedia works-videos, photos, flash etc. One of the unique features, of the two successful website is availability of geographical customization- provision of custom made packages for different geographies. 


Travel websites

Travel websites play a very significant role in tourism marketing and destination branding. Not only do they provide booking facilities for a gamut of tourism activities but also share reviews for tourist destination in the form of – comments, articles, videos and photos. These travel websites are loved by tourism enthusiast and amateur tourists alike and some of them have huge fan following all across the globe. A larger presence in such websites will ensure stronger brand image for destinations. The given part of the report will compare the five destinations across three of the most popular tourism websites- Frommer, Trip Advisor and Virtual tourist

Frommer

Table 4: shows the no. of destination guides, communities and photos for the five destinations in Frommer.

Trip advisor

Table 5: shows the no. of reviews, forums and articles for the five destinations in Trip Advisor.

Virtual tourist

Table 6: shows the no. of tips and reviews, forums and articles for the five destinations in virtual tourist.

With the help of the three tables it could be concluded that none of the destination emerges as a true winner. There is a lot of variability across the three websites. While Frommer and Trip Advisor are dominated by Bangkok; Singapore has stronghold in Virtual Tourist. Even within the sites there are lots of variations. For instance, Istanbul has the 2nd least number of tips & reviews in virtual tourist where as highest number of videos. Another point to be considered is that if there is no winner, there is no loser as well. All the five destinations have substantial presence across the three websites in the form of- reviews, photos, videos, forums and communities.


Facebook

Digital media landscape is transforming, with social media playing a very pivotal role. One of the most popular social media site across the globe is Facebook or FB. FB which is available in more than 70 languages, has more than 800 million active users across the world. More than 50 percentage of active users log on to FB on any given day .On an average, every user is connected to 130 friends and 80 communities, events etc. (Facebook statistics, 2011) with the help of its phenomenal popularity and sheer volume across the globe, FB provides a very vibrant platform for marketers, to communicate and interact with their target customers. It also plays a very prominent role in building brand image for tourist destinations. The given part of the report will compare the brand strength of the five tourist destinations on FB. Since there are many FB pages related to the destinations and comparing all of them not possible; the given analysis will select the most popular page for all the destinations and do a comparison among them.     

The pages are:
Dubai: I Love Dubai 
Istanbul: Istanbul, tours/ sightseeing
Singapore: YourSingapore
Bangkok: Bangkok, public places
Hong Kong: Hong Kong, Attractions, things to do

Fig 9: shows number of likes and people talking about the given destinations on their FB pages. Source: FB pages

Marketing a destination on FB also requires a lot of activities and updates on the group page, besides just having a page. In order to comprehend the level of activities done on each page, a seven day period- 19th Dec to 25th Dec, has been selected. Under the given period, all the activities- updates, likes, comments and shares have been recorded, as depicted by the following table. 

   Table 7: shows the number of updates, comments, likes and shares during 19th to 25th Dec, for individual pages of tourist destinations. (Only updates related to tourism has been included)

On FB, Dubai seems to have an edge over other destinations. Its page “I love Dubai”   can be considered as one of the best well managed and organized FB page for tourist destination across the globe. Properly moderated, it comes up with regular updates of photos and videos, reflecting the grandiose and extravagance of Dubai. The beautiful photo graphs, attract a large number user likes comments and shares. Other cities which come close to Dubai could be Istanbul and Singapore (YourSingapore). Istanbul like Dubai, is well moderated but is also fraught with lot of irrelevant updates- political spoofs, funny pictures etc. Another flaw for page “Istanbul” could be predominant use of Turkish language, which deprives it of an international appeal. YourSingapore is another well managed page but needs more updates. For the other two, lot needs to be done. Large number of user generated updates, which includes greetings and adieus, contradict with the professional outlook expected out of such pages.


You tube

Another powerful social media tool is “You Tube”. Over 800 million of unique users visit You Tube every month. Over 100 million of users take social actions such as like, share and comment on You Tube every week. (Youtube.com press statistics, 2011) You tube does not only play a pivotal role in branding a tourist destination, but also contains negative perception by interacting directly with the tourists. (Sofia R, Brain H, 2010)
 
Fig 10: shows the total number of tourism related searches and total views for top 10 searches, for the five destinations. Column chart shows the no. of searches, whereas line chart with data labels show the total no. of views.  Source: You Tube        

Conclusion and Suggestions

It could be comprehended from various charts and tables that none of the five destinations emerges as a clear cut winner. However, someone close to the numero uno position could Hong Kong, followed by Singapore. Both the city states appear to be comparatively well equipped in building their brand on the web world. Based on the analysis, there are following suggestion, which could help these states further enhance their brand image -

·         Bangkok: with an intake of 10.2 million tourists, it is Asia’s most visited city. (enjoyyourholiday.com, 2011). The city also enjoys a high no of user generated reviews, communities, photos and other user generated contents in travel sites such as trip advisor, virtual tourist etc. However it has comparatively lesser web presence as estimated from the search engine section. In the social media segment it has strong base in You Tube, but needs to use Face Book more aptly. It can also work on its website by adding custom made packages.

·         Istanbul:  is the only city in the globe, stretched across two continents- Asia and Europe. In most of the sections, Istanbul has shown a moderate show, neither too good nor too bad. An area where it needs to put some extra efforts could be You Tube. Another could be official tourist page. The English version (the Turkish version is doing good with 2,00,000 visitors over November 2011) which definitely engaging as reflected from the average time spent, is still not attracting large volume of visitors like its counterpart, Singapore and Hong Kong. One possible measure could be annexing a Russian and German version as Turkey receives quite a good number of tourist arrivals from the two countries. 


·         Dubai: like Istanbul, Dubai has also showcased moderate performance across most of the sections. One area where it has been exceptional could be FB page “I love Dubai”. With arsenal of spellbinding photographs of Dubai, has been successful in its attempts of engaging and communicating with people. Besides working on platforms like virtual tourists, Dubai can rework on its official tourist site. Adding custom made packages and an Arabic version can help in more traffics.


·         Hong Kong and Singapore: are already strong on the web. A simple piece of advice for Hong Kong could be linking social pages with the official tourist website.


Limitations

The given report has some fundamental limitations such as:

·         Search engines: based on the keywords, the number of searches give only an approximate estimation of web content available. More ever the total number of searches keeps on varying with time to time.

·         Reviews: reviews themselves are not 100 % accurate estimation of the brand presence, since it is not just the numbers but quality of reviews that also matters. More over a negative review can be detrimental to the brand value.  

·         Google double ad click: the unique visitors, page views and average time spent, calculated by Google double ad click are just estimation rather than the exact data. However out of many website measurement tools available on the internet, it is considered as the most authentic by many web media evangelist.     


Reference
1>    Nguyen N, 2007,tourism trends and the effect of online booking for Vietnam travel market, available < http://www.findvietnamresorts.com/company/advertise/research.pdf>
2>    Quan Z, Rich D, 2005, Usability issue in city tourism websites: content analysis, p-3, available at http://www.arlt-lectures.com/cross-cult-city-tour.pdf
3>    Facebook statistics center, 2011, available at http://www.facebook.com/press/info.php?statistics
4>    Youtube.com, 2011,press statistics, available at < http://www.youtube.com/t/press_statistics>
5>    Sofia r, Brain H, 2010, the use of you tube as tourism marketing tool, available at < http://eresearch.qmu.ac.uk/2315/1/2315.PDF>
6>    Enjoyyourholiday.com, 2011, top 10 visited cities in the world, available at < http://www.enjoyourholiday.com/2011/04/18/top-10-most-visited-cities-in-the-world/>  
 

Fig 1: online brand display image. Source: reactorr.com