Showing posts with label ABU DHABI. Show all posts

Friday, December 30, 2011

Comparative Analysis: Digital presence of five leading tourism destinations of Asia


Introduction

In the present context, which is marked by the gradual shrinkage of regular and conventional media and arrival of digital media, tourism industry is undergoing a rapid transformation. Digital media has become very significant for the travel and tourism industry. It plays a very crucial role in the entire cycle, a traveler undergoes-selection, planning, information gathering, booking, and visit. The following table gives a list of e-marketing activities corresponding to various stages of travel. (Nguyen N, 2007)

Table 1: shows the e-marketing activities corresponding to various stages of travel.


In order to up their ante in this transformed tourism landscape, it is essential for tourist destinations to have a strong presence across various web platforms- travel websites, social media, social media, and mobile application etc. The following report will analyze the online brand strength of leading tourist destinations from Asia- Hong Kong, Singapore, Bangkok, Dubai and Istanbul. It will do a comparative analysis of the online brand presence across the following platforms- search engines (Yahoo and Google), travel websites (Trip Advisor, Frommer, Virtual Tourist, official tourist websites) and social media (Face Book and You Tube) etc.      

Search engines
Search engines play a vital role in any form of marketing. The following part provides a simple estimate of search results related to the five locations in Google and Yahoo, two of search engine giants.

Fig 2: shows the image search results in millions for the five destination in Yahoo & Google

Fig 3: shows the image search results in millions for the five destination in Yahoo & Google

Fig 4: shows the video search results in millions for the five destination in Yahoo & Google

Fig 5: shows the number of search engine results in millions on typing- name of the destination followed by hotels. Exp: Singapore Hotels

Fig6: shows search results in million in Google and Yahoo on typing places to visit. For exp: Hong Kong places to visit.  

Official tourist websites

Websites are the representation of the tourist destinations in the web world. Not only do they build the brand image of the destination but also guide unaware tourist by providing all the relevant information in detail. It helps traveler make travelling decision. Some of the essential requirements of travelers are- direction information/map, visa and policy information, local information, photo gallery, multilingual functions, content categorization, multimedia functions, utility functions etc.  (Quan Z, Rich D, 2005)    Out of all the available websites, the role of an official website is always much more significant, since it represents the official view point. The given part of the report intents to analyze the popularity of official tourist websites of the five destinations both In terms of web analytics as well as qualitative aspects of the website. For web analytics measurement double click ad planner will be used.

Official Websites of tourist destination

Singapore:  YourSingapore.com (www.yoursingapore.com )
Dubai: DefinitelyDubai.com (http://www.definitelydubai.com/)
Bangkok: Bangkoktourist.com (http://www.bangkoktourist.com/)
Istanbul: Istanbul.com (http://english.istanbul.com/)
Hong Kong: DiscoverHongkong.com (www.discoverhongkong.com )

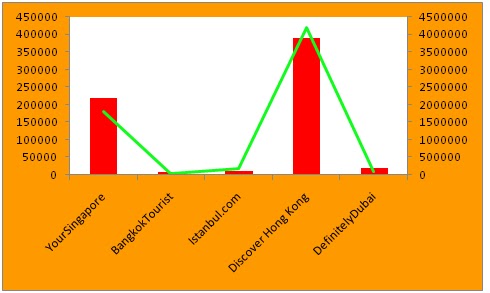
Fig 7: shows the total unique visits and page views for the five official sites, over the month of November 2011. The column chart shows unique visits, where as the line graph shows the page views. Source: double click ad planner. 

Fig 8: shows the average time spent by a visitor in minutes: seconds. Source: double click ad planner

Table 2: compares the home page of the five official websites across some of the basic parameters.

. Table 3: compares the home page of the five official websites across some of the advanced parameters

In terms of unique visitors and total page views, discover Hong Kong has an insurmountable lead over others. This is followed by Singapore; others are far behind. Discover Hong Kong is available in 14 different languages, a unique feature missing in other websites. The closest to this, is Definitely Dubai, which is available in 5 different languages. Other than the multilingual function most of the websites provide all the basic function listed in table 1.  It is the advanced parameters which seem to be the differentiating factor. Yours Singapore has all the five features, followed by Hong Kong with four. The other three have three each. All the five websites have designed very attractive website with lot of multimedia works-videos, photos, flash etc. One of the unique features, of the two successful website is availability of geographical customization- provision of custom made packages for different geographies. 


Travel websites

Travel websites play a very significant role in tourism marketing and destination branding. Not only do they provide booking facilities for a gamut of tourism activities but also share reviews for tourist destination in the form of – comments, articles, videos and photos. These travel websites are loved by tourism enthusiast and amateur tourists alike and some of them have huge fan following all across the globe. A larger presence in such websites will ensure stronger brand image for destinations. The given part of the report will compare the five destinations across three of the most popular tourism websites- Frommer, Trip Advisor and Virtual tourist

Frommer

Table 4: shows the no. of destination guides, communities and photos for the five destinations in Frommer.

Trip advisor

Table 5: shows the no. of reviews, forums and articles for the five destinations in Trip Advisor.

Virtual tourist

Table 6: shows the no. of tips and reviews, forums and articles for the five destinations in virtual tourist.

With the help of the three tables it could be concluded that none of the destination emerges as a true winner. There is a lot of variability across the three websites. While Frommer and Trip Advisor are dominated by Bangkok; Singapore has stronghold in Virtual Tourist. Even within the sites there are lots of variations. For instance, Istanbul has the 2nd least number of tips & reviews in virtual tourist where as highest number of videos. Another point to be considered is that if there is no winner, there is no loser as well. All the five destinations have substantial presence across the three websites in the form of- reviews, photos, videos, forums and communities.


Facebook

Digital media landscape is transforming, with social media playing a very pivotal role. One of the most popular social media site across the globe is Facebook or FB. FB which is available in more than 70 languages, has more than 800 million active users across the world. More than 50 percentage of active users log on to FB on any given day .On an average, every user is connected to 130 friends and 80 communities, events etc. (Facebook statistics, 2011) with the help of its phenomenal popularity and sheer volume across the globe, FB provides a very vibrant platform for marketers, to communicate and interact with their target customers. It also plays a very prominent role in building brand image for tourist destinations. The given part of the report will compare the brand strength of the five tourist destinations on FB. Since there are many FB pages related to the destinations and comparing all of them not possible; the given analysis will select the most popular page for all the destinations and do a comparison among them.     

The pages are:
Dubai: I Love Dubai 
Istanbul: Istanbul, tours/ sightseeing
Singapore: YourSingapore
Bangkok: Bangkok, public places
Hong Kong: Hong Kong, Attractions, things to do

Fig 9: shows number of likes and people talking about the given destinations on their FB pages. Source: FB pages

Marketing a destination on FB also requires a lot of activities and updates on the group page, besides just having a page. In order to comprehend the level of activities done on each page, a seven day period- 19th Dec to 25th Dec, has been selected. Under the given period, all the activities- updates, likes, comments and shares have been recorded, as depicted by the following table. 

   Table 7: shows the number of updates, comments, likes and shares during 19th to 25th Dec, for individual pages of tourist destinations. (Only updates related to tourism has been included)

On FB, Dubai seems to have an edge over other destinations. Its page “I love Dubai”   can be considered as one of the best well managed and organized FB page for tourist destination across the globe. Properly moderated, it comes up with regular updates of photos and videos, reflecting the grandiose and extravagance of Dubai. The beautiful photo graphs, attract a large number user likes comments and shares. Other cities which come close to Dubai could be Istanbul and Singapore (YourSingapore). Istanbul like Dubai, is well moderated but is also fraught with lot of irrelevant updates- political spoofs, funny pictures etc. Another flaw for page “Istanbul” could be predominant use of Turkish language, which deprives it of an international appeal. YourSingapore is another well managed page but needs more updates. For the other two, lot needs to be done. Large number of user generated updates, which includes greetings and adieus, contradict with the professional outlook expected out of such pages.


You tube

Another powerful social media tool is “You Tube”. Over 800 million of unique users visit You Tube every month. Over 100 million of users take social actions such as like, share and comment on You Tube every week. (Youtube.com press statistics, 2011) You tube does not only play a pivotal role in branding a tourist destination, but also contains negative perception by interacting directly with the tourists. (Sofia R, Brain H, 2010)
 
Fig 10: shows the total number of tourism related searches and total views for top 10 searches, for the five destinations. Column chart shows the no. of searches, whereas line chart with data labels show the total no. of views.  Source: You Tube        

Conclusion and Suggestions

It could be comprehended from various charts and tables that none of the five destinations emerges as a clear cut winner. However, someone close to the numero uno position could Hong Kong, followed by Singapore. Both the city states appear to be comparatively well equipped in building their brand on the web world. Based on the analysis, there are following suggestion, which could help these states further enhance their brand image -

·         Bangkok: with an intake of 10.2 million tourists, it is Asia’s most visited city. (enjoyyourholiday.com, 2011). The city also enjoys a high no of user generated reviews, communities, photos and other user generated contents in travel sites such as trip advisor, virtual tourist etc. However it has comparatively lesser web presence as estimated from the search engine section. In the social media segment it has strong base in You Tube, but needs to use Face Book more aptly. It can also work on its website by adding custom made packages.

·         Istanbul:  is the only city in the globe, stretched across two continents- Asia and Europe. In most of the sections, Istanbul has shown a moderate show, neither too good nor too bad. An area where it needs to put some extra efforts could be You Tube. Another could be official tourist page. The English version (the Turkish version is doing good with 2,00,000 visitors over November 2011) which definitely engaging as reflected from the average time spent, is still not attracting large volume of visitors like its counterpart, Singapore and Hong Kong. One possible measure could be annexing a Russian and German version as Turkey receives quite a good number of tourist arrivals from the two countries. 


·         Dubai: like Istanbul, Dubai has also showcased moderate performance across most of the sections. One area where it has been exceptional could be FB page “I love Dubai”. With arsenal of spellbinding photographs of Dubai, has been successful in its attempts of engaging and communicating with people. Besides working on platforms like virtual tourists, Dubai can rework on its official tourist site. Adding custom made packages and an Arabic version can help in more traffics.


·         Hong Kong and Singapore: are already strong on the web. A simple piece of advice for Hong Kong could be linking social pages with the official tourist website.


Limitations

The given report has some fundamental limitations such as:

·         Search engines: based on the keywords, the number of searches give only an approximate estimation of web content available. More ever the total number of searches keeps on varying with time to time.

·         Reviews: reviews themselves are not 100 % accurate estimation of the brand presence, since it is not just the numbers but quality of reviews that also matters. More over a negative review can be detrimental to the brand value.  

·         Google double ad click: the unique visitors, page views and average time spent, calculated by Google double ad click are just estimation rather than the exact data. However out of many website measurement tools available on the internet, it is considered as the most authentic by many web media evangelist.     


Reference
1>    Nguyen N, 2007,tourism trends and the effect of online booking for Vietnam travel market, available < http://www.findvietnamresorts.com/company/advertise/research.pdf>
2>    Quan Z, Rich D, 2005, Usability issue in city tourism websites: content analysis, p-3, available at http://www.arlt-lectures.com/cross-cult-city-tour.pdf
3>    Facebook statistics center, 2011, available at http://www.facebook.com/press/info.php?statistics
4>    Youtube.com, 2011,press statistics, available at < http://www.youtube.com/t/press_statistics>
5>    Sofia r, Brain H, 2010, the use of you tube as tourism marketing tool, available at < http://eresearch.qmu.ac.uk/2315/1/2315.PDF>
6>    Enjoyyourholiday.com, 2011, top 10 visited cities in the world, available at < http://www.enjoyourholiday.com/2011/04/18/top-10-most-visited-cities-in-the-world/>  
 

Fig 1: online brand display image. Source: reactorr.com

Saturday, June 4, 2011

Etisalat : Strategic Analysis

                                      Fig 1: Etisalat Logo ( source : PTCL worker.com)
                                                   
 The given blog is exclusively dedicated to the telecomm giant from Middle East, UAE based Etisalat. Etisalat is among, one of the non oil sector based success stories from the Gulf and the given blog will do a detailed analysis for it. This will consist of the basic introduction followed by the overall telecomm market in UAE. In the next part the growth and expansion of various businesses of Etisalat over the last decade will be studied,  followed by some of the major international subsidies of Etisalat. In the concluding part the future strategies of Etisalat will be analyzed. Once the blog will be done, another blog, dealing with the financials of Etisalat will be rolled out soon.

Introduction

Emirates Telecommunication Corporation, branded as Etisalat is one of the major telecommunication companies in the world, operating across Middle East, Asia and Africa. It provides mobile and fixed line data and voice services to individuals, enterprises, telecomm companies etc. It also provides a wide range of high tech and complimentary services to telecomm companies including SIM card manufacturing, payment solutions, staff training, peering, voice and data transit, sub marine and land cable services. (Etisalat.ae, 2011)


The company was founded in 1976 as a joint venture between International Aeradio limited, a British company and local partners. Later on in 1983, the govt. of UAE had a 60% stake in the company and rest was publicly traded. From 36,000 exchange lines in 1976, it was having around 7, 47,000 lines in 1998. Today Etisalat is considered as one of the biggest success sagas in Middle East and is one of the biggest contributors to the UAE government after the traditional oil sector. Currently operating in 18 nations world wide, it enjoys around 135 Million aggregate subscribers and annual revenue of US $ 8.7 billion. (Etisalat Annual report, 2010)

Table 1:  various companies of the overall Etisalat group


Fig 2: shows breakdown of revenue (as on Dec, 2010) (Source: Etisalat annual report 2010)


Fig 3: shows the breakdown of Etisalat group as on Dec, 2009 (source: Etisalat annual report 2009)

Telecommunication sector in UAE:-


The growth of telecommunication sector at UAE had been synonymous with the growth of Etisalat, its major telecommunication company. The telecom sector in UAE had been highly regulated with Etisalat having monopoly in the market for most of the time. In spite of having monopoly like many of its other Emirati counterparts, Etisalat had always been upfront in coming up with newer technologies and value based innovation in the market. By 2005 mobile penetration was more than 100 % where as internet and broad band penetration was more than 60 %. The market dynamics changed in 2006 with the emergence of Du, another telecomm company in the market. (2dayDubai.com, 2009) Du is owned- 40 % by Dubai government, 20% by Mubadala, 20% by TECOM (Dubai technology and commerce free zone) and rest 20 % is owned through publicly listed shares in Dubai financial market. Presently due to saturation as well as competition the top line of the Etisalat, the major telecomm company seems to be affected in UAE, but it is growing rapidly through international expansion and acquisitions of other players. Moreover the overall ICT sector of UAE (consisting of IT along with telecom) is poised for a strong growth in the coming time. Both the major Emirates of UAE- Dubai as well as Abu Dhabi have ambitious growth plans in the form of Dubai 2015 and Abu Dhabi 2030 respectively and they realize the fact that strong ICT sector is a precondition for achieving these ambitious plans. The ICT sector is expected to get strong boost due to multibillion dollar infrastructure development plans, economic diversification and an exuberant SME segment, in the nearby future.


Growth of Etisalat over the last ten years


From a humble beginning in 1976, Etisalat has grown into a giant organization. According to financial times it holds 140th position among the top 500 companies, in terms of market capitalization. By the mid of 2000 Etisalat had evolved  from a local player that provided basic wire line and data services to an international player providing a wide range of sophisticated services. The given section will discuss the growth track of Etisalat


Fig 8: showing the revenue and net profit of Etisalat, over the last eight years, Source: (Annual Reports 2002, 2005 and 2010)


                      Fig 5: Annual Etisalat mobile subscriber in UAE, over the last ten years (Source: Annual Report 2002, 2004 and 2010)


Key Insights from fig 4:-


• The CAGR (compound annual growth rate) for mobile subscribers , for the  period of last 10 years  is 18.5%

• The CAGR for 2000-05 is 26.1%, whereas for 2005-10 is 11.4%.

• There has not been any substantial growth in the last three years.


Fig 6: Annual Etisalat fixed line subscriber in UAE, over the last ten years (Source : Annual Report 2002, 2005, 2010)
Key Insights from fig 5:


• The CAGR for number of fixed line subscribers over the  period of last 10 years is very modest at 1.97 %.

• The CAGR for the period 2000-05 is 4 % whereas for 2005-10, there had not been any substantial growth

• The overall fixed line market for Etisalat UAE had reduced in the last two years.


              Fig 7: shows the total number of internet subscribers in UAE over the last 10 years, Source( Annual Report 2002, 2005 and 2010)

Key Insights:Etihad Etisalat:


• The CAGR of internet subscribers for Etisalat UAE, over the period of last 10 years is 20.2 %

• The CAGR for 2000-05 is 20.3%, whereas for 2005-10 is 20 %.

• After showing substantial year on year growth for the 1st nine years, the market has taken a dip in the last year.

Fig 8: shows the national as well as international calls in billion minutes, over the last ten years, Source ( Annual Report 2002, 2005, 2010)  

Key Insights:


• The CAGR for, national calls is 10.5 %, international calls is 11.9 %, over the last 10 years.

• The CAGR during 2000-05, for national calls is 18.2% and for international calls is 25.31 %. The CAGR during 2005-10, for national calls is 3.3 % and for international calls is 0 %.

• Both national as well as international calls have taken dip in the last two years.

General Insights:

After studying all the above graphs two important trends are emerging:-

• Etisalat has shown strong growth in all the sections during 2000-05, compared to 2005-10.

• In every section, the market is reducing down for Etisalat in UAE in the last couple of years, owing to saturation (In 2008 penetration in the mobile market had already reached 190 %, hence providing less scope for further expansion), competition by DU and global economic slowdown.

Global Expansion:


Etisalat operates across 18 nations in the Middle East, Africa and Asia. It is one of the fastest emerging global telecomm brands, primarily identifying underserved markets and targeting them with high quality, value based innovative services. The international expansion strategy for Etisalat consists of both, having fully owned subsidies as well as having majority and minority stake in various existing local telecom companies. In its tryst with inorganic growth and expansion, Etisalat had so far got commendable success. It is known for entering aggressivley into new markets and expanding the subscriber base very quickly. The following part will  discuss some of the Geographical success stories of Etisalat.


Etisalat Misr


Etisalat entered into Egypt (also called Misr in Arabic) in 2006, as 3rd mobile service provider in the country. Within 50 days of its launch it captured a base of one million subscribers, which had increased to around 10 million by today. Etisalat’s 2G network covers around 98 % of population while 3G network covers around 73 % of the population. (Etisalat.ae, 2011)
Atlantique Telecom, Moov

Atlantique Telecom (AT) operates in seven countries across West Africa. Etisalat initially had a 50 % stake in AT, which  increased over a period of time and eventually by February 2010, it has  full ownership of AT. Though all the seven nations are different in their socio economic cum political outlook but Moov, the common brand name for AT across the region, enjoys a very strong brand value. The region which is underserved with a low penetration presents a very strong potential for future growth. AT has a coverage of 54 % in the region.

Etisalat Nigeria

Nigeria, the most populous African state with 22 % mobile penetration is high up on Etisalat’s agenda of international expansion. Etisalat entered into the Nigerian market in October 2008 and known for its aggressive early movements, captured one million subscribers by June. By September 2011 it was having a subscriber base of 5 million. Etisalat is known in Nigeria for its top quality service and within year of its launch had been credited with the best service provider by the national telecom regulatory authority, Nigerian Communication Commission (NCC). Currently Etisalat is active across all the 36 states in Nigeria and has coverage of 73 %.

                  Fig 9: Growth of subscriber base of Etisalat Nigeria, source: (www.itp.net)


Etihad Etisalat (also branded as Mobily) is the second mobile service provider in the kingdom of Saudi Arabia after Saudi Telecom. It entered into Saudi Arabia in May 2005, after winning the bid for second GSM license. Mobily was one of the fastest growing GSM service providers in Middle East and North Africa and captured 3.8 Million subscribers, just within a year of its launch. Presently it has more than 17 million subscribers. Etisalat’s GSM service covers almost 97 % of the populated areas where as the 3.75 G service covers 80 % of the populated areas in Saudi Arabia. Etisalat has a 27 % share in Mobily where as 45 % are with six local partners, rest are publicly traded. (Etisalat.ae, 2011)


Pakistan Telecommunication Public Limited (PTCL)

Founded in 1947, Pakistan Telecommunication Public limited or PTCL is the largest telecomm service provider in Pakistan. In 2006, the Pakistan govt. sold 26% stake to Etisalat. 62 % is retained by the govt. whereas the rest 12 % is publicly traded.


Future Strategy


Etisalat is truly a global brand, with operations spread across 18 nations all over the globe. The future of Etisalat depends how well it expands in to various new geographies and technologies along with the kind of value based innovation it brings into the existing portfolios of geographies and product. Though a considerable part of revenue will come from the UAE, but due to intensifying competition and saturation of the market, maintaining a healthy top line from UAE will not be very easy. Following factors can play important role in deciding the future strategy for Etisalat: -


• New Markets: - newer markets like India and Sri Lanka will play a crucial role in influencing future strategy of Etisalat. Many of the existing markets like Pakistan, Sudan Tanzania and Waste Africa are still underserved and have huge future growth potential. Take for instance Sudan where fixed line penetration is just 1-2 %, and hence offers a great growth potential for telecom majors like Etisalat. Similarly India a nation with a population 115 Million and a penetration of 43 % provides strong growth opportunities. Though competition is quite intense in India with 12 players fighting for their share of pie, the sheer size of Indian market can deliver profitability to many of the competent players at the same time. Similarly in Africa, where many  nations are expected to achieve strong economic growth , the mobile, internet and fixed line penetrations are expected to shoot up, thereby providing a strong growth potential. Along with the existing markets, Etisalat needs , continue searching for newer underserved markets, and devise strategies for them.

Table 2 : calculates the future market potential for Etisalat


Future Growth of UAE: - UAE has strong future growth plans in the form of Dubai 2015 and Abu Dhabi 2029. UAE no more wants to be solely dependent on petroleum for its revenue and aims at diversify into various alternate industries such as ICT, High tech, defense, tourism, trade, media, SME segment etc. Currently these sectors are seeking huge capital investment and the expected future growth will influence Etisalat’s business in a positive way.


Innovative products for local markets:- Like any other globalized company, Etisalat needs to understand the dynamics of the local market and  come up with innovative solutions, customized for the local markets. One very good example can be the partnership between Etisalat Afghanistan and PTCL, which offered attractive rates between the two countries, resulting in quadrupling of traffic since the launch in 2010.  Etisalat needs to roll out such  innovative customized packages to lure more customers.


Content generation and monetization of mobile content: is an area, which can have future growth potential for Etisalat. (Comm.com, 2011)


Newer technologies: - The top management at Etisalat believes “Cloud Computing” as a deeply transformational trend worldwide, and  is planning to launch a wide range of service in this field in the near time. Another area that provides a great future potential is M2M (Machine to Machine) technologies. Etisalat is attempting to develop industry specific solutions in the given field. M2M technology holds a great future potential. According to research done by Research Infonetics in 2009 there were 87 million mobile embedded M2M connections, which are forecast to rise to 428 million by 2014, a compound annual growth rate (CAGR) of 38 %. (Comm.com, 2011)


# Un Served present market size= population * Coverage * (100 – Penetration) * Etisalat’s stake

Reference  

1> Etisalat.ae, 2011, company website, about us: corporate profile,


2> Etisalat annual report, 2010, p-3,


3> 2dayDubai.com, 2009, United Arab Emirates ICT sector and Dubai’s knowledge economy, available at < http://www.2daydubai.com/pages/dubai-ict-sector.php>


4> Etisalat.ae, 2011, Etisalat Misr, Etisalat.ae, 2011, Etisalat Etihad ‘ Mobily’ Saudi Arabia,


5> Comm.com, 2011, Seizing the moment, available at< C:\Documents and Settings\Administrator\Desktop\etisalat vs Du\Seizing the moment Comm_ Decisive coverage of telecommunications strategy.mht >


6> Comm.com, 2011, Seizing the moment, available at < C:\Documents and Settings\Administrator\Desktop\etisalat vs Du\Seizing the moment Comm_ Decisive coverage of telecommunications strategy.mht >
.

Friday, May 6, 2011

SWOT Analysis of SME segment of UAE

                      fig: Abu Dhabi( source: emiratespalaceabudhabi.com)    

For any nation a vibrant SME  (small and medium enterprise) segment does not only play an important role in providing vibrancy to the national economy but also  a very important role in providing employment and unwinding entrepreneurial spirit of the population. In the following blog author will be doing a SWOT analysis of the SME sector at UAE.


SME primarily means small and medium enterprises. Different nations have different definitions for the SME segment. According to the definition by European Union companies with up to; 250 employees come under medium enterprise, 50 employees come under small enterprise and 10 come under micro enterprises. Another global definition has been defined by Standard Charted bank that places any organization with a turnover of US $ 1 Million to US $ 25 Million under the SME segment.


SME segment has the following advantage:-

• It’s an important constituent of economy and a major source of employment for many of the emerging economies across the world. In many of the economies around 90% of the non oil GDP comes from the SME segment. SMEs constitute 50% of the global GDP and employs 85% of the world population. (Dun and Bradstreet, 2008)

• Helps in realizing entrepreneurial zeal and creativity of individuals.

• Helps in diversification of the economy.

• Due to ease of entry and exit into the SME segment, it helps  building more elastic and competitive economies.

Along with the usual benefits, SMEs do have their own disadvantages that are as follows:

• These are usually small companies lacking management capacities.

• They find it tough to afford various support services such as, financial services, HR services, IT support etc, which hampers their productivity.

• SMEs have been hit hard by the global economic crisis on two fronts, due to credit crunch as well as customers owing money to them finding it tough to pay back. This had resulted in closing down of many of the SMEs across the globe.


Government across the entire MENA (Middle East and North Africa) and GCC (gulf cooperative council) are emphasizing strongly on the SME segments. UAE one of the important constituent of the GCC has got a very strong SME segment with more than 70% of the non oil GDP coming from the SME segment (Chris Bruin, 2010). The major Emirates of UAE , both Dubai as well as Abu Dhabi have got ambitious socio economic development plans in the form of Dubai 2015 and Abu Dhabi 2030 with a strong focus on SME segment.

The following table shows some important facts and figures regarding the SME segment in UAE


SMEs by Emirates and Sector (Source: Dun & Bradstreet, 2008)


 SWOT Analysis of SME sector in UAE
Strengths:

• Strong economy: as a nation UAE is a rich country with huge oil, trade and tourism revenue. This helps in providing the required institutional support for the emerging SMEs in the Emirates.

• Rise of oil prices: the rise of oil prices have resulted in stronger economy for UAE, eventually resulting into stronger confidence among the business fraternity and higher disposable income for consumption. This will surely have positive impact on the SME segment. (Emirates 24/7, 2011)

• Efficient government: The govt. authorities at UAE are known for their efficiency and speed of execution. As a part of their plans for Emiratization and economic diversification, they are keeping the SME segment high up on their agenda. Both at Abu Dhabi and Dubai associations, intended for encouraging and supporting SME segments, had been formed.

• Intra Regional trade: SMEs are expected to be benefitted by the rise in trade across the MENA region. (Emirates 24/7, 2011)

• Strategic position: UAE is placed strategically between the cross roads of West and East and North and South. This strategic position helps it to attract and retain businesses and human resource talent from all across the globe.

• There had been rapid growth in lending activities for the SME sector in the recent years, from 2003 to 2008 there had been an increase of 200% in lending activities for individuals for business purpose. Along with domestic banks many of the MNC banks like Standard Charted and HSBC have their dedicated business units at UAE, catering specifically to the SME segment. Some of the banks active in SME lending in the given geography are- HSBC, Mashreq, RAK, Union national bank, ADCB, Citi bank etc (Dun & Bradstreet, 2008)

• SMEs can also draw strength from the Inherent strength of Dubai and Abu Dhabi as trading hubs and regional financial centers.


Weakness

• In spite of a booming SME segment, they keep facing various challenges in the form of high start up cost and difficult access to capital. In spite of growth in credit for SMEs, most of the individual businesses still complain about lack of capital. According to a research conducted by Dun & Bradstreet loan rejection  has been estimated to be in the range of 50 to 70%.

• Other challenges include high registration fee, high rental charges, information asymmetry etc. (Dun and Bradstreet, 2009)

• SMEs are vulnerable to low financial buffer, low margins and high operating cost.

• In UAE though some 90 percentage of the firms come under the SME segment where as SME also contribute one third of the GDP, the figure is still low in comparison to other developed and emerging economies where the contribution of the SME segment is around 60 percentage.


Opportunities

• SMEs will get a great boost by the abolishment of the minimum capital requirement of US $ 40, 000 (150,000 DH) for setting up of a limited liability company in UAE. (Dun & Bradstreet, 2009)

• Some of the SMEs are quite competent. Around 58% of them are expected to be operating internationally by 2013. (Emirates 24/7, 2011)

• SMEs at UAE are also expected to be benefited by the increase in international activities by the SMEs worldwide. It is expected that by 2013, number of SMEs worldwide, conducting international activities will increase from 29 % to 40 %. (Emirates 24/7, 2011)

• As a part of their economic growth plans, the Emirates of UAE are planning to diversify into various alternate industries other than the usual ones like petroleum, tourism trading etc such as petrochemicals, education, media, metal works, aerospace, telecommunications etc. Such industries will require a cluster of SMEs working around them and providing various types of support and enabling functions. This will surely boost the SME segment at UAE.

• The Emirates in UAE are coming up with new platforms to encourage and support SMEs. Mohammed Bin Rashid establishment for young business leader had been established in 2002, which specializes in providing financial assistance, training and inspiration to UAE nationals in starting their own business. Another such initiative is “SME 100” that awards top 100 SMEs in Dubai. The Khalifa fund provides funds and training for startups at Abu Dhabi. Such strong initiatives taken by the government will definitely help the SME segment in the long run.


Threats

• As a region Middle East is susceptible to political unrest and turmoil. Though UAE has one of the most popular, efficient and transparent govt. in practice and there is no threat of any impending political unrest in the gulf state, but since the MENA region as a whole is prone to political upheavals, it can affect the intra regional trade, considered very important for the SME segment.

• Compared to other emerging and developed economies, SMEs at UAE are still not matured enough.

• Growing globalization will pose new competitive challenge to the SMEs at UAE.

• SMEs at UAE will also be prone to threat from the bigger industries of UAE. The SMEs will find it hard to match them in terms of management and technical skills, quality and cost effectiveness which their bigger counterparts can produce on account of their scale.


As any other business entity, the SME segment at UAE has its own pros and cons. Some of the them are  structural while some are  conditional. Beyond the given pros and cons, one thing that can not be denied is that, SMEs definitely had a great role to play in the nearby future of the UAE and the govt. authorities in association with private sector  will not prefer keeping any stone unturned in further boosting and encouraging the sector.

Reference:

1> Chris B, 2010, Supporting SME essential for UAE’s growth, Emirates 24/7, available at http://www.emirates247.com/2.308/comment/supporting-smes-essential-for-uae-growth- 2010-06-30-1.261304

2> Dun and Bradstreet, 2008, D&B business insight series: SME lending in UAE 2008, p-3, available at< http://www.dnbsame.com/downloads/D&B_SME.pdf >

3> Emirates 24/7, 2011, 58% UAE SME to go global in 2 years, available at http://www.emirates247.com/business/economy-finance/58-uae-smes-to-go-global-in-2-years-2011-01- 23-1.345825

4> Emirates 24/7, 2011, 58% UAE SME to go global in 2 years, available at http://www.emirates247.com/business/economy-finance/58-uae-smes-to-go-global-in-2-years-2011-01- 23-1.345825

5> Dun and Bradstreet, 2008, D&B business insight series: SME lending in UAE 2008, p-3, available at< http://www.dnbsame.com/downloads/D&B_SME.pdf >

6> Dun & Bradstreet, 2009, Challenges still remain despite removal of LLC capital, available at < http://www.dnbsame.com/news_aug20.html >

7> Dun & Bradstreet, 2009, Challenges still remain despite removal of LLC capital, available at < http://www.dnbsame.com/news_aug20.html >

8> Emirates 24/7, 2011, 58% UAE SME to go global in 2 years, available at http://www.emirates247.com/business/economy-finance/58-uae-smes-to-go-global-in-2-years-2011-01- 23-1.345825

9> Emirates 24/7, 2011, 58% UAE SME to go global in 2 years, available at http://www.emirates247.com/business/economy-finance/58-uae-smes-to-go-global-in-2-years-2011-01- 23-1.345825