Showing posts with label DUBAI. Show all posts

Friday, December 30, 2011

Comparative Analysis: Digital presence of five leading tourism destinations of Asia


Introduction

In the present context, which is marked by the gradual shrinkage of regular and conventional media and arrival of digital media, tourism industry is undergoing a rapid transformation. Digital media has become very significant for the travel and tourism industry. It plays a very crucial role in the entire cycle, a traveler undergoes-selection, planning, information gathering, booking, and visit. The following table gives a list of e-marketing activities corresponding to various stages of travel. (Nguyen N, 2007)

Table 1: shows the e-marketing activities corresponding to various stages of travel.


In order to up their ante in this transformed tourism landscape, it is essential for tourist destinations to have a strong presence across various web platforms- travel websites, social media, social media, and mobile application etc. The following report will analyze the online brand strength of leading tourist destinations from Asia- Hong Kong, Singapore, Bangkok, Dubai and Istanbul. It will do a comparative analysis of the online brand presence across the following platforms- search engines (Yahoo and Google), travel websites (Trip Advisor, Frommer, Virtual Tourist, official tourist websites) and social media (Face Book and You Tube) etc.      

Search engines
Search engines play a vital role in any form of marketing. The following part provides a simple estimate of search results related to the five locations in Google and Yahoo, two of search engine giants.

Fig 2: shows the image search results in millions for the five destination in Yahoo & Google

Fig 3: shows the image search results in millions for the five destination in Yahoo & Google

Fig 4: shows the video search results in millions for the five destination in Yahoo & Google

Fig 5: shows the number of search engine results in millions on typing- name of the destination followed by hotels. Exp: Singapore Hotels

Fig6: shows search results in million in Google and Yahoo on typing places to visit. For exp: Hong Kong places to visit.  

Official tourist websites

Websites are the representation of the tourist destinations in the web world. Not only do they build the brand image of the destination but also guide unaware tourist by providing all the relevant information in detail. It helps traveler make travelling decision. Some of the essential requirements of travelers are- direction information/map, visa and policy information, local information, photo gallery, multilingual functions, content categorization, multimedia functions, utility functions etc.  (Quan Z, Rich D, 2005)    Out of all the available websites, the role of an official website is always much more significant, since it represents the official view point. The given part of the report intents to analyze the popularity of official tourist websites of the five destinations both In terms of web analytics as well as qualitative aspects of the website. For web analytics measurement double click ad planner will be used.

Official Websites of tourist destination
Singapore:  YourSingapore.com (www.yoursingapore.com )
Dubai: DefinitelyDubai.com (http://www.definitelydubai.com/)
Bangkok: Bangkoktourist.com (http://www.bangkoktourist.com/)
Istanbul: Istanbul.com (http://english.istanbul.com/)
Hong Kong: DiscoverHongkong.com (www.discoverhongkong.com )

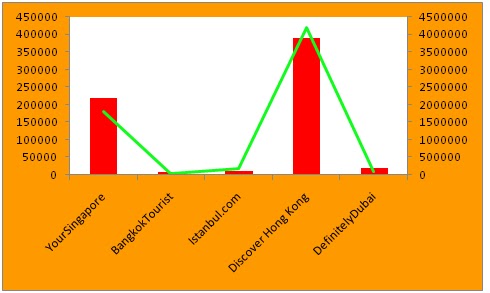
Fig 7: shows the total unique visits and page views for the five official sites, over the month of November 2011. The column chart shows unique visits, where as the line graph shows the page views. Source: double click ad planner. 

Fig 8: shows the average time spent by a visitor in minutes: seconds. Source: double click ad planner

Table 2: compares the home page of the five official websites across some of the basic parameters.

. Table 3: compares the home page of the five official websites across some of the advanced parameters

In terms of unique visitors and total page views, discover Hong Kong has an insurmountable lead over others. This is followed by Singapore; others are far behind. Discover Hong Kong is available in 14 different languages, a unique feature missing in other websites. The closest to this, is Definitely Dubai, which is available in 5 different languages. Other than the multilingual function most of the websites provide all the basic function listed in table 1.  It is the advanced parameters which seem to be the differentiating factor. Yours Singapore has all the five features, followed by Hong Kong with four. The other three have three each. All the five websites have designed very attractive website with lot of multimedia works-videos, photos, flash etc. One of the unique features, of the two successful website is availability of geographical customization- provision of custom made packages for different geographies. 


Travel websites

Travel websites play a very significant role in tourism marketing and destination branding. Not only do they provide booking facilities for a gamut of tourism activities but also share reviews for tourist destination in the form of – comments, articles, videos and photos. These travel websites are loved by tourism enthusiast and amateur tourists alike and some of them have huge fan following all across the globe. A larger presence in such websites will ensure stronger brand image for destinations. The given part of the report will compare the five destinations across three of the most popular tourism websites- Frommer, Trip Advisor and Virtual tourist

Frommer

Table 4: shows the no. of destination guides, communities and photos for the five destinations in Frommer.

Trip advisor

Table 5: shows the no. of reviews, forums and articles for the five destinations in Trip Advisor.

Virtual tourist

Table 6: shows the no. of tips and reviews, forums and articles for the five destinations in virtual tourist.

With the help of the three tables it could be concluded that none of the destination emerges as a true winner. There is a lot of variability across the three websites. While Frommer and Trip Advisor are dominated by Bangkok; Singapore has stronghold in Virtual Tourist. Even within the sites there are lots of variations. For instance, Istanbul has the 2nd least number of tips & reviews in virtual tourist where as highest number of videos. Another point to be considered is that if there is no winner, there is no loser as well. All the five destinations have substantial presence across the three websites in the form of- reviews, photos, videos, forums and communities.


Facebook

Digital media landscape is transforming, with social media playing a very pivotal role. One of the most popular social media site across the globe is Facebook or FB. FB which is available in more than 70 languages, has more than 800 million active users across the world. More than 50 percentage of active users log on to FB on any given day .On an average, every user is connected to 130 friends and 80 communities, events etc. (Facebook statistics, 2011) with the help of its phenomenal popularity and sheer volume across the globe, FB provides a very vibrant platform for marketers, to communicate and interact with their target customers. It also plays a very prominent role in building brand image for tourist destinations. The given part of the report will compare the brand strength of the five tourist destinations on FB. Since there are many FB pages related to the destinations and comparing all of them not possible; the given analysis will select the most popular page for all the destinations and do a comparison among them.     

The pages are:
Dubai: I Love Dubai 
Istanbul: Istanbul, tours/ sightseeing
Singapore: YourSingapore
Bangkok: Bangkok, public places
Hong Kong: Hong Kong, Attractions, things to do

Fig 9: shows number of likes and people talking about the given destinations on their FB pages. Source: FB pages

Marketing a destination on FB also requires a lot of activities and updates on the group page, besides just having a page. In order to comprehend the level of activities done on each page, a seven day period- 19th Dec to 25th Dec, has been selected. Under the given period, all the activities- updates, likes, comments and shares have been recorded, as depicted by the following table. 

   Table 7: shows the number of updates, comments, likes and shares during 19th to 25th Dec, for individual pages of tourist destinations. (Only updates related to tourism has been included)

On FB, Dubai seems to have an edge over other destinations. Its page “I love Dubai”   can be considered as one of the best well managed and organized FB page for tourist destination across the globe. Properly moderated, it comes up with regular updates of photos and videos, reflecting the grandiose and extravagance of Dubai. The beautiful photo graphs, attract a large number user likes comments and shares. Other cities which come close to Dubai could be Istanbul and Singapore (YourSingapore). Istanbul like Dubai, is well moderated but is also fraught with lot of irrelevant updates- political spoofs, funny pictures etc. Another flaw for page “Istanbul” could be predominant use of Turkish language, which deprives it of an international appeal. YourSingapore is another well managed page but needs more updates. For the other two, lot needs to be done. Large number of user generated updates, which includes greetings and adieus, contradict with the professional outlook expected out of such pages.


You tube

Another powerful social media tool is “You Tube”. Over 800 million of unique users visit You Tube every month. Over 100 million of users take social actions such as like, share and comment on You Tube every week. (Youtube.com press statistics, 2011) You tube does not only play a pivotal role in branding a tourist destination, but also contains negative perception by interacting directly with the tourists. (Sofia R, Brain H, 2010)
 
Fig 10: shows the total number of tourism related searches and total views for top 10 searches, for the five destinations. Column chart shows the no. of searches, whereas line chart with data labels show the total no. of views.  Source: You Tube        

Conclusion and Suggestions

It could be comprehended from various charts and tables that none of the five destinations emerges as a clear cut winner. However, someone close to the numero uno position could Hong Kong, followed by Singapore. Both the city states appear to be comparatively well equipped in building their brand on the web world. Based on the analysis, there are following suggestion, which could help these states further enhance their brand image -

·         Bangkok: with an intake of 10.2 million tourists, it is Asia’s most visited city. (enjoyyourholiday.com, 2011). The city also enjoys a high no of user generated reviews, communities, photos and other user generated contents in travel sites such as trip advisor, virtual tourist etc. However it has comparatively lesser web presence as estimated from the search engine section. In the social media segment it has strong base in You Tube, but needs to use Face Book more aptly. It can also work on its website by adding custom made packages.

·         Istanbul:  is the only city in the globe, stretched across two continents- Asia and Europe. In most of the sections, Istanbul has shown a moderate show, neither too good nor too bad. An area where it needs to put some extra efforts could be You Tube. Another could be official tourist page. The English version (the Turkish version is doing good with 2,00,000 visitors over November 2011) which definitely engaging as reflected from the average time spent, is still not attracting large volume of visitors like its counterpart, Singapore and Hong Kong. One possible measure could be annexing a Russian and German version as Turkey receives quite a good number of tourist arrivals from the two countries. 


·         Dubai: like Istanbul, Dubai has also showcased moderate performance across most of the sections. One area where it has been exceptional could be FB page “I love Dubai”. With arsenal of spellbinding photographs of Dubai, has been successful in its attempts of engaging and communicating with people. Besides working on platforms like virtual tourists, Dubai can rework on its official tourist site. Adding custom made packages and an Arabic version can help in more traffics.


·         Hong Kong and Singapore: are already strong on the web. A simple piece of advice for Hong Kong could be linking social pages with the official tourist website.


Limitations

The given report has some fundamental limitations such as:

·         Search engines: based on the keywords, the number of searches give only an approximate estimation of web content available. More ever the total number of searches keeps on varying with time to time.

·         Reviews: reviews themselves are not 100 % accurate estimation of the brand presence, since it is not just the numbers but quality of reviews that also matters. More over a negative review can be detrimental to the brand value.  

·         Google double ad click: the unique visitors, page views and average time spent, calculated by Google double ad click are just estimation rather than the exact data. However out of many website measurement tools available on the internet, it is considered as the most authentic by many web media evangelist.     


Reference
1>    Nguyen N, 2007,tourism trends and the effect of online booking for Vietnam travel market, available < http://www.findvietnamresorts.com/company/advertise/research.pdf>
2>    Quan Z, Rich D, 2005, Usability issue in city tourism websites: content analysis, p-3, available at http://www.arlt-lectures.com/cross-cult-city-tour.pdf
3>    Facebook statistics center, 2011, available at http://www.facebook.com/press/info.php?statistics
4>    Youtube.com, 2011,press statistics, available at < http://www.youtube.com/t/press_statistics>
5>    Sofia r, Brain H, 2010, the use of you tube as tourism marketing tool, available at < http://eresearch.qmu.ac.uk/2315/1/2315.PDF>
6>    Enjoyyourholiday.com, 2011, top 10 visited cities in the world, available at < http://www.enjoyourholiday.com/2011/04/18/top-10-most-visited-cities-in-the-world/>  
 

Fig 1: online brand display image. Source: reactorr.com

Sunday, December 11, 2011

Comparative Analysis of the three rising stars of Asia- Hong Kong, Singapore & Dubai


        Fig 1: Skyline of Singapore. Source: Wikipedia                                                                    

Singapore, Hong Kong, and Dubai are three major city states, of international standing in Asia. All of them have undergone a phenomenal growth in the last few decades and plays a very pivotal role in the economy of their respective nations and even regions. Considered among some of the best marketed destinations in the globe; they bring in a huge amount of investments along with human capital. All these three city states constantly feature among the list of top 10, most visited cities in the world. The following blog will do a comparative analysis of the following places across a wide range of qualitative as well as quantitative parameters.

Introduction

·         Dubai: is one of the most well marketed destinations, across the globe. In the three decades, the small emirate has seen itself leapfrogging from a sleepy town to one of the biggest success saga of Middle East. Placed between the cross roads of East and West, Dubai is also sometimes known as the gateway of the Middle East to the world. The biggest strength of Dubai lies in its visionary and extremely efficient leadership and liberal culture, helping it attract expats from all over the world. It is among the very first Gulf States, that has successfully diversified its economy into various sectors such as-tourism, real estates, retail, trade, media, financial services etc.  The very first thing that comes to mind with brand Dubai is the state of art real estate constructions. Dubai boasts some of the biggest, most expensive, state of the art buildings, hotels and real estate assignments- Al Burj, Burj Khalifa, Palm islands etc. Other than these world famous  landmarks Dubai offers plethora of state of the art shopping malls, amusement parks, museums, resorts and spa, golf courses, sports stadiums, convention centers etc.
 
·         Singapore: the small city state which once got freedom in 1963 from Malaysia; is not only among one of the most visited cities across the globe; but also an epicenter of trade, commerce, finance, technology and innovation. Considered among the biggest success sagas of 20th centuries, Singapore had witnessed an average growth rate of 7.9 percentages, since 1963.  The Singapore’s success story is based on four pillars- liberal govt. policies, skilled workforce, state of the art sea ports and strategic location. During the time of 60’s and 70’s when this tiny state was suffering from high unemployment, liberal policy frame work was put in place, along with investments in labor incentive industries. In the later stage, Singapore successfully transformed itself from a labor incentive industry to an innovation driven industry. Today it is home to around 500 financial institutions and most of the MNCs of the world. It also has a numero uno position in the “ease of doing business index”. (World Bank data, 2010) Singapore is also great tourist hub with state of the art hotels, resorts, shopping malls, casinos etc. In 2009, it received 9.7 million tourists and was among the list of most visited cities in the world. (annual report on tourism statistics 2009, 2011)


·         Hong Kong: it’s a place where East meets the West. Before being handed over to China in 1997, Hong Kong was under British Rule. Even today other than foreign relations and military defense, it maintains a high degree of autonomy. In contrast to mainland China, it enjoys a capitalist structure marked by free trade and low taxation. It is considered as one of the freest economies of the world. Famous economist Milton Friedman once described that if someone wants to see free economy, he should go to go to Hong Kong. Like Singapore it is a major trade and financial center. Like the other three Asian tigers (Singapore, Taiwan and South Korea) Hong Kong underwent industrialization during 60’s and successfully transformed into a service sector economy during 80’s. In 2010 service sector has accounted for 92.5 percentage of GDP, against Industry contributing just 7.4 percentages. (CIA World Fact Book, 2010). A blend of Chinese and Western culture, Hong Kong is also a fabulous tourist destination attracting tourists from all over the globe.     

Demographics

All these three places are trade centers and financial capitals of their respective regions, besides being great tourist destinations; there by attracting a large number of expats- businessmen, travelers, working professionals, academicians, celebrities etc. According to the survey conducted by Dubai Statistics Center in 2006, 17 percentages of the population consists of local Emiratis. 71 percentages of the population consist of Asian which mainly includes- Indian, Pakistani, Srilankan, etc. 3 percentage of population has been categorized as Western.  In contrast to this in Hong Kong, according to 2006 census 95 percentages of the work force is Chinese followed by Filipino (1.6 percentage), Indonesian (1.3 percentage) and others 2.1 percentage. (Index Mundi, 2011). In Singapore out of the total population of 5.08 million, 3.77 million are Singapore residents against 1.31 million foreign residents. (Comprising of tourists) Out of 3.77 million, residents 3.23 million are citizens where as 0.54 millions are permanent residents. Major ethnic communities include Chinese, Malay, and Indians etc. 0.3 percentage of the population can be categorized as Western.  (Department of statistics Singapore, 2011) 


Fig 2: compares the population of three states for the year 2010. Source of data: Dubai Statistics center, Singapore Statistics center and CIA World fact book.


Fig 3: shows the population of the three city states in millions, over the period of time. Source of data: Hong Kong year book, Dubai Chamber of Commerce, Department of Statistics Singapore
Table 1: compares the three city states across various parameters. Reference year: 2010; Source of data: US department of State, Index Mundi etc

.

                Table 2: compares the three city states across geographical parameters.


Economics


The following section will compare the three city states across some of the economic parameters- Gross Domestic product (GDP), Foreign Direct Investments (FDI), Cost of living Index etc.


Fig 3: showing the GDP of the three city states, US $ billions, for the year 2010. Source: CIA Fact Book, Al Arabia news.

Fig 4: showing the GDP growth rate of the three city states in the past few years. Source: World Bank, Dubai Statistics Center.


Fig 5: showing FDI inflow of the three city states in US $ billions, over the last 6 years. Source: World Bank, Dubai Statistics center.


Table 3: compares the 3 city states across various cost of living indices. Source: NUMBEO


Tourism statistics

Other than being epicenter of trade, commerce and financial activities, the three states are also considered among some of the greatest tourist destinations in the globe. Constantly featuring among the top 10 most visited cities in the globe, they have some of the most magnificent hotels, resorts, casinos, convention centers, amusement parks etc. The following line graph of the report will compare the 3 city states in terms of annual tourist arrivals

Fig 6: showing annual arrival of tourists in millions. Source: Dubai Tourism and Commercial Marketing (DTCM), Press releases by Hong Kong tourism board, Singapore Tourism Board. The comparatively higher figure for Hong Kong is on account on Chinese travelers, which account for approximately 2/3rd of tourist arrival. 


BRAND ESSENCE

This part of the report will try figuring out one word, which can describe the brand of these city states.

Dubai had successfully ventured into wide range of activities ranging from various forms of tourism (leisure, shopping, sports, cultural, dessert, business etc); trade, businesses, industries etc; but one word describing brand Dubai can be luxury. It’s a place where modern day dynamism blends well with traditional Arabic tranquility. Be it the state of the art hotels or resorts; shopping malls or villas; everywhere Dubai reflects luxury. For Singapore, that one word could be innovation. Singapore is the hub of high tech innovation. According to Global Innovation Index 2011, Singapore has been ranked as 3rd most innovative nation in the world and 1st in Asia. (Sgentrepreneurs.com, 2011). Similarly one word that can reflect the brand essence of city state Hong Kong could be liberty. Hong Kong is one of the most free and liberal states in the world. It practices liberty in almost every sphere of life- economic, social, political, etc. It offers a top notch living conditions or its residents. Ranked 13th on the Human Development Index, it is one of the best places to live. Singapore has a rank of 26, whereas Dubai (UAE) has a rank of 30. (Human Development Index and its Component, 2011)


Fig 8: Shows the brand essence of the three city states in one word.
ANALYSIS & conclusion

The given report had tried analyzing the three city states of Asia across various parameters related to demography, economy, tourism etc. With the help of various charts it could be seen that Dubai is still catching up with the Singapore and Hong Kong and will take some time to reach their level. Dubai is an Emirate with extremely big ambitions. For instance by 2015, the Dubai Tourism and Commercial Marketing aims at reaching an annual tourist arrival of 15 million. Though time will tell how far Dubai will excel to realize this ambition; but if realized Dubai will be the most visited tourist destination in the world. Similarly in other spheres also the 2nd largest emirate of UAE holds huge ambitions. Exp: Jebel Ali, the largest man made harbor is also undergoing expansion and once completed in 2030, it is expected to be the biggest container port in the world.


The social and economic structures of these three city states have their own similarities as well as differences. Singapore and Hong Kong are quite synonymous to each other in terms of knowledge economy, high degree of social freedom & liberty and international trade centers; Dubai offers a slightly different case. Though Dubai has successfully diversified its economy (presently Hydrocarbons account for only 2.1 percentage of GDP, contrary to 1985, when it had a giant share of 55 percentages) into real estate, trade and tourism; it is still far behind from becoming a knowledge economy. Similarly in terms of demographic break up, Dubai’s economy is completely dependent on expats, in contrast to local Emiratis which constitute only 17 percentage of population. (Dubaidreams.net, 2011). It is the other way round in Hong Kong and Singapore.


Table 4: shows the diminishing percentage of oil in Dubai’s GDP. Source: USA Today, AME info.com, Dubai Chamber of Commerce

Dubai has its own advantage. It is yet to realize its full potential and hence has a long way to go. In the form of its ambitious 2015 plan, it aims at implementing strong social and economic reforms and transformations. It is one of the fastest growing Emirates and prior to the economic crisis that led to real estate bust; it was enjoying a double digit growth rate. Considered as an epicenter of trade, finance, investments, culture and tourism in the Middle East region, it had help attracting a lot of investments, trade and human capital for the region.


If IT and Technology defines Singapore and Hong Kong; real estate defines Dubai.  It is marked by luxury, which gets reflected in the wide range of high profile construction projects incubated by the Emirate. One of the reasons, it can accommodate such projects, is the availability of large amount of free space. While Singapore and Hong Kong are becoming vertical cities, Dubai still enjoys a population density of 408 per square Kilometer, much lesser than most of the major cities in the world. It is also comparatively economical in comparison to the other two cities. (as shown in table 3). In a nutshell, Dubai has carved a unique niche for itself. Created amidst a dessert, it has successfully transformed itself from a sleepy oil rich emirate, where once hydrocarbon accounted for more than 50 percentage of GDP to one of the most economically diversified and socially liberal state in the region.


In terms of political structure Dubai and Singapore share a similar kind of structure. Both of them are blessed with visionary political leadership, which played a pivotal role in their exorbitant growth. They have got an extremely efficient political and bureaucratic apparatus, known for executing big projects swiftly. Contrary to this in Hong Kong, govt. has a minimal role to play in the economic ambit. In fact Hong Kong has one of the most liberal economies across the globe.   


In spite of having differences across various economic and social parameters, there are lots of things common in the three states. On Economic front, all of them have liberal economic policies marked by low tax and tariff rates, helping them attract a large amount of investments and top notch human capital. All of them have shown phenomenal growth rate in the recent past. They share a lot of similarities in terms of landscape and geography. They are islands, have extended coastlines, and are situated in strategic locations, which helped them morphed into excellent trading centers. Not blessed with much of exotic natural landscapes, they made huge investments in developing state of the art hotels, beach resorts, golf courses, convention centers, shopping malls; there by transforming into magnificent leisure and business tourism destination. High tourist arrivals have also been very advantageous for their retail sector. On social front, all three of them are marked by open and liberal cosmopolitan culture, attracting expats from all over the globe and providing a platform to grow and flourish. This ability of attracting diversified human resource from various parts of globe had eventually been very beneficial to them.


The three city states converges as well as diverges across different parameters; but one thing that is common to all is the phenomenal success story they have scripted for themselves in such a small interval of time. They came from nowhere and today are destinations of international standing. These city states, developed from scratch, are product of- strategic planning, die hard entrepreneurial spirit and openness towards change. Hong Kong, Singapore and Dubai-these are the rising stars of the East, without any substantial past, but definitely with an illustrious present and future.
 

Saturday, November 5, 2011

Comparative Analysis of the tourism sector of the Gulf countries and Nordic countries


                              Fig 1: Travel & Tourism competitiveness report (Source: The Armenian Observer Blog)
                                    
In the world of tourism, geographical clusters play a very important role. Attractiveness of individual states does not only depend on them, but a large part of it also depends on the attractiveness of the whole region as a tourist destination. This concept is more applicable in small states. Bigger state like India and China or heavily popular and strongly marketed states like Dubai or Singapore are quite independent of their regions but for other places regional clusters do play a very significant role. For exp: Jordan’s attractiveness as a tourist destination will be dependent on the attractiveness of Arab world / MENA region.
It has following impacts:

·         Marketing and Branding: helps in the marketing of the whole cluster/ region. If a region has quite a good number of tourist destinations, then it helps in promoting the whole region as a tourist destination, eventually helping in promoting, often overlooked locations.   
·         Complimentary packages: these days’ tourists prefer tour packages comprising two or more nations. Hence availability of a good number of tourist destinations in single region helps in developing better tour packages. For exp: lot of tourists visiting UK prefers combo packages comprising of England, Ireland, and Scotland. Tourists visiting South East Asia prefer combo packages comprising of Malaysia, Indonesia, Singapore and Thailand.      
·         Regional cooperation: Tourism is a highly capital intensive industry and it requires huge investment in infrastructure as well as marketing. Regional economic cooperation among the nations in a region enables in developing better infrastructure- in the form of hotels, resorts, roads, airports etc.

The following blog article will do a comparative analysis of two geographical cluster- Gulf countries and Nordic countries. Both the clusters consist of economically well off nations with small population and surface area. Hence they provide a good case to do comparison. The documents used for this are – The Global Competitiveness report and World Economic Forum travel and tourism competitiveness. (Some of the terms have been directly used from WEF report. Their meanings have been explained in the end. )    


COMPARISON OF Economic & social indicators FOR THE SIX GULF STATES

Table 1: Showing population of the six Gulf States. (Source: WEF, travel and tourism competency report 2011.)

Aggregate Population: 37.8 Million
Aggregate Surface Area: 2423.2 (000 SQ KM)

Fig 2: Pie chart showing GDP of individual Gulf States. (Source: WEF travel and tourism competency report 2011.)  

Aggregate GDP: US $ 863.6 Billion

Fig 3: Showing per capita GDP (PPP, US $) .Source: WEF, travel and tourism report, 2011. 


 Fig 4: Showing environment performance index of the six Gulf States. (Source: WEF, travel and tourism competency report, 2011.) 


The Gulf States are comparatively small states with Saudi Arabia being the biggest and most populous while Bahrain being the smallest and least populous. Saudi Arabia on account of being the biggest state is also the biggest economy, followed by UAE. Qatar, one of the fastest economies of the world enjoys the highest per capita GDP among the Gulf States. Other Gulf States shows a high degree of uniformity in terms of per capita GDP with per capita GDP lying between US $ 25,000- 35,000. The average environmental performance index is 127, with UAE showing the highest value of 152 and Saudi Arabia showing the lowest value of 99.

 Tourism statistics of gulf state


  Fig 5: Showing T&T industry and economy receipt (US $ Billion) of the six Gulf Nations. Source: (WEF, travel and tourism competency report, 2011.)

Fig 6: Showing, per capita T&T industry and economy receipt (US $) of the six Gulf Nations. Source: (WEF, travel and tourism competency report, 2011.)

Table 2: Showing the overall competencies of six Gulf Nations. Source: WEF travel and tourism industry report 2011.   

Analysis: Dubai is considered as gateway of, Middle East to the whole world and it gets reflected in the above figure. In both categories- Tourism receipt as well as tourism receipt as a percentage of GDP, UAE holds a numero uno position. UAE is followed by Saudi Arabia which receives a considerable amount of tourism receipt on account of conducting the very famous Hajj festival, where Muslim pilgrims from all around the globe come to Mecca. For most of the other Gulf nations, tourism still does not seem to be playing any significant role. 

Table 3: Showing population and surface area of the five Nordic nations. (Source: WEF travel and tourism competency report, 2011)

Fig 7: Showing the GDP (US $ Billion) of the five Nordic Nations. Source: (WEF travel and tourism competency report, 2011)

Fig 8: Showing the per capita GDP (PPP, US $) of the six Nordic Nations. (Source: WEF, travel and tourism competency report, 2011)

Fig 9: Showing environmental performance index of the six Nordic Nations, 2011. (Source: WEF, travel and tourism competency report, 2011) 

 Like Gulf countries, Nordic countries are also small nations with Iceland being the smallest and Sweden being the largest. Considered as one of the safest and happiest places in the globe, these states enjoy very low rate of crime, high per capita GDP and high standard of living. Most of the nations have per capita GDP in the range US $ 35,000-40,000, with Norway being an exception. The Nordic nation has a per capita GDP of US$ 51,980. One of the remarkable features of the Nordic nations is exceptionally good environmental performance index. The Numero Uno position in this ranking, which comprises of 139 nations, is with Iceland, smallest Nordic nation. Al most all the nations other than Denmark are ranked within 15 in this ranking.   

          Table 4: Showing Travel and Tourism competency, of the five Nordic Nations. (Source:     Travel and Tourism Competency 2011.)

Average attractiveness: 5.1

Fig 10: Showing T&T industry and economy receipt (US $ Billion) of the Five Nordic Nations. Source: (WEF, travel and tourism competency report, 2011.)

Fig 11: Showing, per capita T&T industry and economy receipt (US $ Billion) of the Five Nordic Nations. Source: (WEF, travel and tourism competency report, 2011.)

Comparison

 Table 5: Comparison of Gulf and Nordic Nations across various parameters. (Source: WEF travel and tourism report, 2011)

Fig 12: Comparison of Gulf and Nordic Nations across T&T industry and economy receipt. (Source:  WEF travel and tourism report, 2011)

 Fig 13: Comparison of scores of Gulf and Nordic Nations across, various WEF competitive parameters. (Source: WEF travel and tourism report, 2011)

Analysis: On being compared, the Nordic nations surely score better than the Gulf countries in almost all the parameters, socio-economic as well as statistics pertaining to tourism. Nordic nations have bigger aggregate GDP and enjoy higher per capita than the Gulf countries. An area where the Nordic nations have done exceptionally good is environmental performance and there seems to be a wide gap between the two clusters, across this parameter. Coming to T&T industry receipt, Nordic nations have received US $ 37.3 billion against US $ 22.93 billion received by Gulf countries. An important trend which could be seen over here is that, when compared across T&T economy receipt, the difference has narrowed down. Nordic nations have received US $ 114.83 billion against US $ 103 billion received by Gulf countries. The reason for this small difference could be the multibillion dollar tourism development projects, being incubated all across the Gulf. Given the fact that oil will not last for long, Gulf countries are realizing the significance of economic diversification and tourism is high up on their agenda. In nations where tourism does not contribute much in the GDP, huge investments are being made in developing state of the art tourism facilities. Qatar- the tourism industry in the state estimated at US $ 961 million in 2010 constitutes just 0.9% of the GDP but on account of some of the extravagant tourism development assignments, the overall economic impact is estimated at US $ 9,348 millions, constituting 8.4% of the GDP. (WEF_TravelTourismCompetitiveness Report, 2011) When compared across various WEF competitive parameters, Nordic nations again have a considerable edge over their Gulf counter parts. Comparatively lean across parameters such as T&T business environment and infrastructure and high across others such as human cultural and natural resources and regulatory frame works. With an average score of 5.1 in the overall competitiveness, the Nordic nations are among the top performers in the overall WEF ranking, consisting of around 139 nations where as with an average score of 4.3, Gulf countries are among the “slightly better than the average band”.  
Since both the clusters share a lot of similarity, in terms of various socio economic parameters, Nordic nations, with a better performance with the Gulf countries, could be a good role model for the Gulf countries.           


Use of key terms


·         The T & T competitiveness index is a measurement of factors that make a country, an attractive tourist destination. It consists of T&T regulatory frame work, T&T business environment, T&T human cultural and natural resources.  Countries are ranked on a scale of 1 to 6, with one being the lowest and 6 being the lowest.
·         T&T regulatory frame work consists of Policy rules and regulation, environmental sustainability, safety and security, health and hygiene and prioritization of travel and tourism. Countries are ranked on a scale of 1 to 6, with one being the lowest and 6 being the lowest.
·         T&T business environment and infrastructure consists of air transport, ground transport, tourism, and ICT infrastructure along with price competitiveness. Countries are ranked on a scale of 1 to 6, with one being the lowest and 6 being the lowest.
·          T&T human cultural and natural resources consist of human resources, affinity to tourism, cultural and natural resources. Countries are ranked on a scale of 1 to 6, with one being the lowest and 6 being the lowest.
·         T&T industry as a narrow perspective of T&T activity that captures the production-side
              Industry contribution that is, direct impact only (WEF report, p-105)

·         The T&T economy is a broader perspective of Travel & Tourism that takes into consideration the direct as well as the indirect contributions by traditional travel service providers and industry suppliers within the resident economy. (WEF, p-105)

  
Reference
ü  WEF_TravelTourismCompetitiveness Report, 2011, Qatar-Country/Economy profile, p-316